Skip to contents

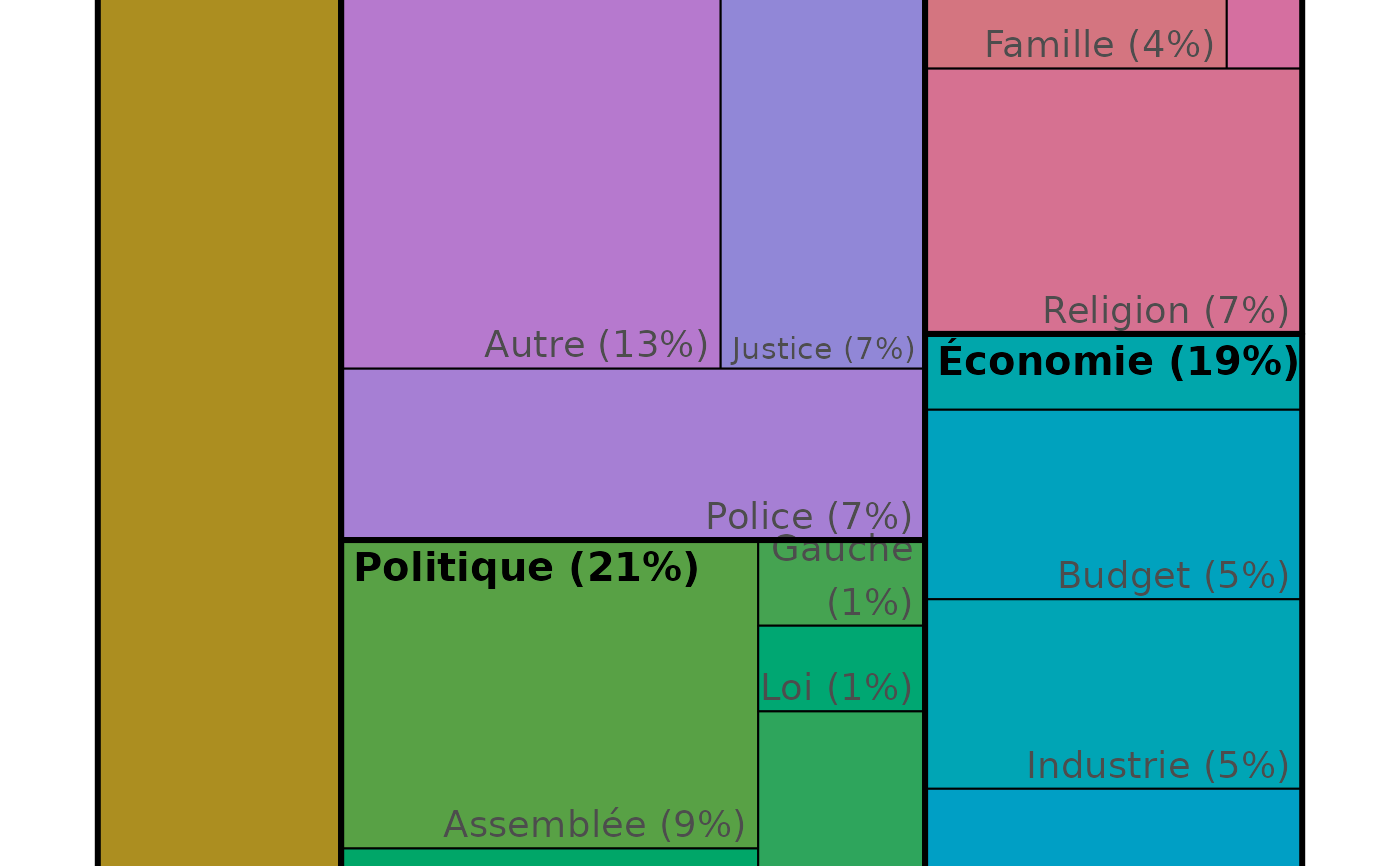
Plot a treemap of thema and classe of segments

Usage

treemap_double_classe(
  df,
  id_theme,
  theme,
  classe,
  threshold = 30,
  title = "Treemap",
  footer = "",
  palette = NA
)

Arguments

df

data.frame with theme and classe

id_theme

id of theme (to order it)

theme

name of theme variable

classe

name of classe variable

threshold

minimum frequent of classe to show

title

title of the treemap

(optional) footer of the treemap

palette

(optional) palette to color theme

Value

plot

Examples

df_segment <- read.csv(lexico_example("df_segment.csv"))
treemap_double_classe(df_segment,"id_classe","classe","classe_local",0)